Localidata is a Spanish company that provides an API to access their semantic data. We can request information about business premises, district geometries and many more.
In order to use this API you have to use a api_key that you get when you register.
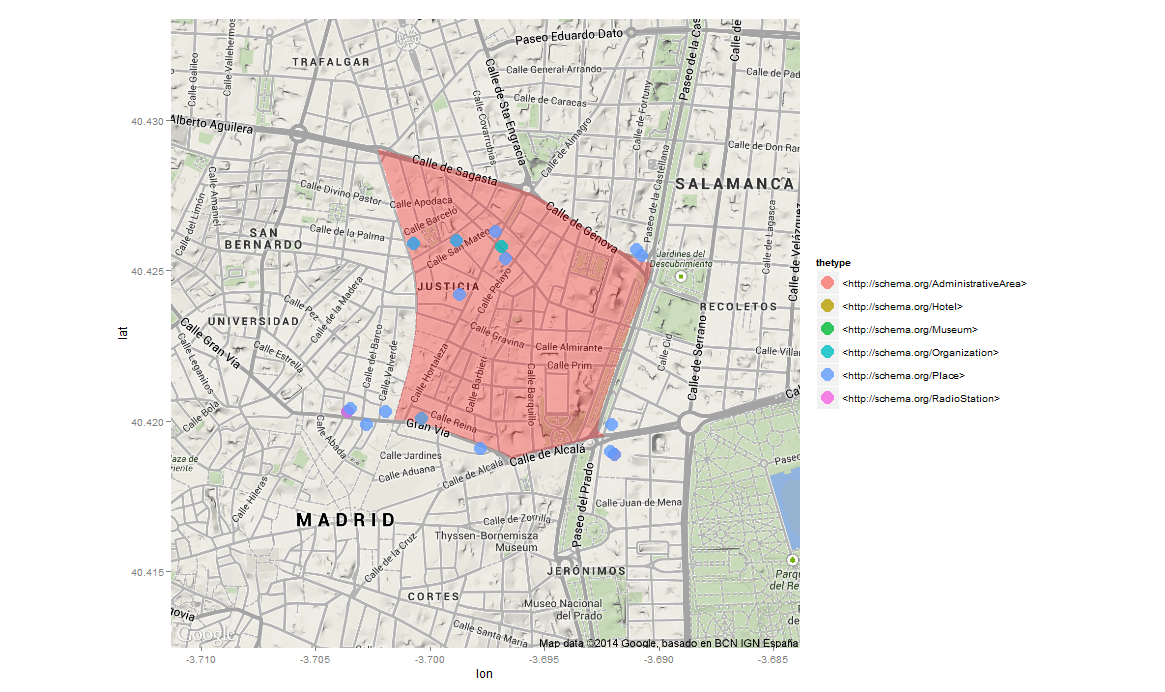
With this example in R you can get from Localidata the contour segments of the Justicia district (in Madrid) and, following the first example, display the locations known by esDBpedia.
library(httr)
library(jsonlite)
library(ggmap)
library(SPARQL)
#Example without pagination
#Info about the Justicia district (code 280796014)
res <- GET("http://datos.localidata.com",
            path = "recurso/territorio/Barrio/280796014.geojson",
            query = list(
                         api_key = "YOU_API_KEY",
                         `_view` = "coordenadas" #You have to escape variables starting with _
                        )
          )

json <- fromJSON(rawToChar(res$content)) #The json sent by the server

#You have the polyline with the district frontiers in
#json$features$geometry$coordinates[[1]][[1]][[1]][[N]]
#N coordinates. There are 359 segments.
v_lat <- numeric(length(json$features$geometry$coordinates[[1]][[1]][[1]]))
v_lon <- numeric(length(json$features$geometry$coordinates[[1]][[1]][[1]]))
for (i in 1:length(v_lat)){
  v_lon[i] <- json$features$geometry$coordinates[[1]][[1]][[1]][[i]][1]
  v_lat[i] <- json$features$geometry$coordinates[[1]][[1]][[1]][[i]][2]
}
dfpoli <- data.frame(lat=v_lat, lon=v_lon) #long should NOT change its sign

#Google Map with the district borders
map.center <- geocode("Chueca, Madrid, Spain")
map <- get_map(c(lon=map.center$lon, lat=map.center$lat),
                 source="google", zoom=15)
plot <- ggmap(map) +
  geom_polygon(aes(lon, lat), data = dfpoli, colour = NA, fill = "red", alpha = .3)

#Add esDBpedia geographical data to the map
endpoint <- "http://es.dbpedia.org/sparql"
query <-
"SELECT *  WHERE {
      ?uri geo:lat ?lat .
      ?uri geo:long ?lon .
      ?uri rdf:type ?thetype .
      FILTER ( (?lat> 40.418  && ?lat < 40.430) &&
               (?lon> -3.704  && ?lon <-3.690)
               && regex(?thetype,'^http://schema.org')
             )
}
"
reslist <- SPARQL(endpoint,query)
df <- reslist$results
df$thetype <- factor(df$thetype)
plot + geom_point(data=df,
                        aes(x=lon, y=lat, colour=thetype, position="dodge"),
                        size=6, alpha=0.8
                        )
This is the result
 |