Table of Contents
R example#
It uses the SPARQL R package to query the esDBpedia SPARQL EndPoint. In this example it gets the geolocated resources in the Madrid Community (indeed in Madrid's bounding box]They are classified by their type. For shake of simplicity the schema.org type has been chosen. A resource can have more than one type (e.g. Alcalá de Henares has Place and Hospital).
library(ggplot2)
library(mapproj)
library(ggmap)
library(SPARQL)
endpoint <- "http://es.dbpedia.org/sparql"
query <-
"SELECT *  WHERE {
      ?uri geo:lat ?lat .
      ?uri geo:long ?lon .
      ?uri rdf:type ?thetype .
      FILTER ( (?lat> 40.0  && ?lat < 41.15) &&
               (?lon> 3.1  && ?lon < 4.5)
               && regex(?thetype,'^http://schema.org')
             )
}
"
reslist <- SPARQL(endpoint,query)
df <- reslist$results
df$lon <- -df$lon
df$thetype <- factor(df$thetype)
map.center <- geocode("Madrid, Spain")
map <- get_map(c(lon=map.center$lon, lat=map.center$lat),
                 source="google",  zoom=9)
ggmap(map) + geom_point(data=df,
                        aes(x=lon, y=lat, colour=thetype, position="dodge"),
                        size=6, alpha=0.8
                        )
The result is this graphic (click on this icon 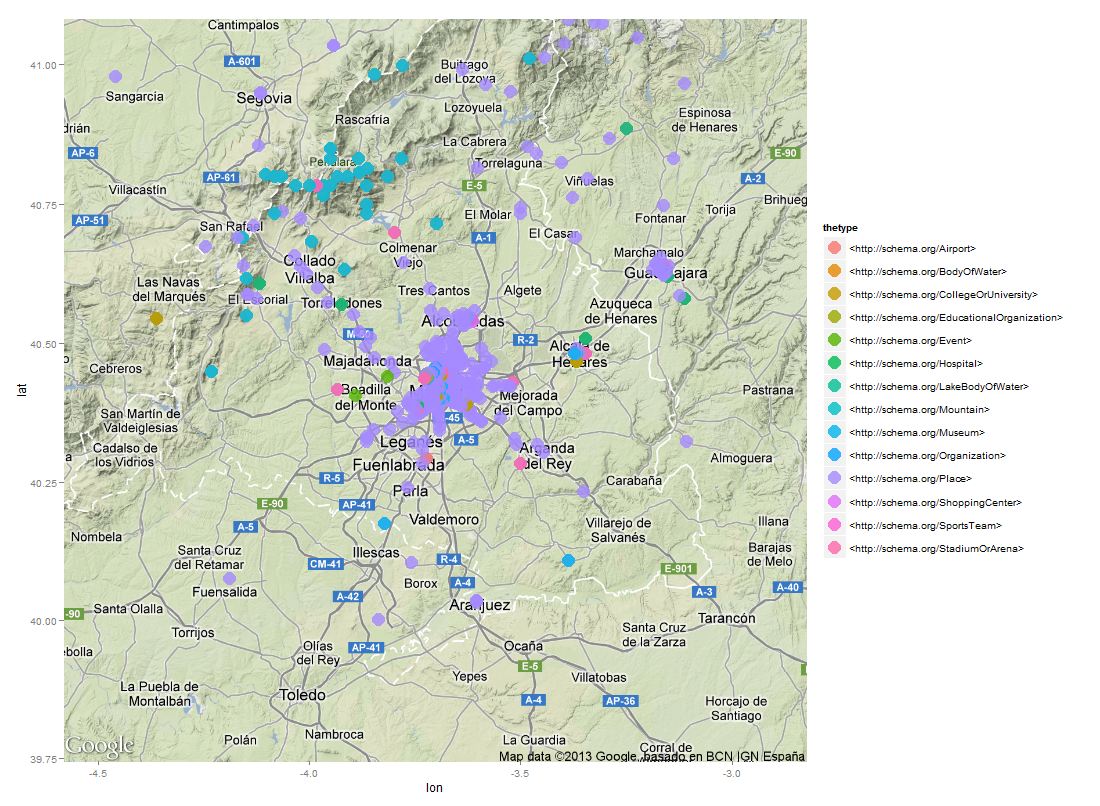 if you can not see the legend on the right side of the map):
|
Notes:
- The lon coordinate (longitude) stored by esDBpedia is positive, that is why we have to add the minus.
- The "dodge" parameter is aimed at distinguish visually two overlapping points. To achieve that, the dots are lightly separated. In areas full of dots is becomes impossible (as is the case for the center of Madrid).
- If anybody knows how to setup a color palette capable of providing a better visualization, please, tell us! :-D.
Javascript example#
Kindly provided by Alejandro F.Carrera
<html><body>
<div id="mapdiv"></div>
<script src="http://www.openlayers.org/api/OpenLayers.js"></script>
<script>

	// SPARQL Query
  	function sparqlQueryJson(queryStr, endpoint, callback, isDebug) {
      var querypart = "query=" + escape(queryStr);
      var xmlhttp = null;
      if(window.XMLHttpRequest) {
        xmlhttp = new XMLHttpRequest();
     } else if(window.ActiveXObject) {
       xmlhttp = new ActiveXObject("Microsoft.XMLHTTP");
     }
     xmlhttp.open('POST', endpoint, true);
     xmlhttp.setRequestHeader('Content-type', 'application/x-www-form-urlencoded');
     xmlhttp.setRequestHeader("Accept", "application/sparql-results+json");
     xmlhttp.onreadystatechange = function() {
       if(xmlhttp.readyState == 4) {
         if(xmlhttp.status == 200) {
           if(isDebug) {
           		// see results of the SPARQL query
           	    alert(xmlhttp.responseText);
           }
           callback(xmlhttp.responseText);
         }
       }
     };
     xmlhttp.send(querypart);
    };

	// OSM Map
	map = new OpenLayers.Map("mapdiv");
    map.addLayer(new OpenLayers.Layer.OSM());
	var center = new OpenLayers.LonLat( -3.65 ,40.4).transform(
            new OpenLayers.Projection("EPSG:4326"),
            map.getProjectionObject()
          );
    var zoom=8;
    map.setCenter (center, zoom);

	var endpoint = "http://dbpedia.org/sparql";
    var query = "SELECT * WHERE {?uri geo:lat ?lat .?uri geo:long ?lon .?uri rdf:type ?thetype .FILTER ( (?lat> 40.0  && ?lat < 41.15) &&(?lon> -3  && ?lon < 4)&& regex(?thetype,'^http://schema.org'))}" ;
    function myCallback(str) {
		str = eval('(' + str + ')');
        for(var i = 0; i<  str.results.bindings.length; i++) {
		  	var la = str.results.bindings[i].lat.value;
		  	var lo = str.results.bindings[i].lon.value;
		  	var pos = new OpenLayers.LonLat( la ,lo).transform(
            	new OpenLayers.Projection("EPSG:4326"),
            	map.getProjectionObject()
          	);
		  	// Add to map as point (la, lo)
        }
     }
    sparqlQueryJson(query, endpoint, myCallback, true);
</script>
</head>
</body></html>
And this is the result:
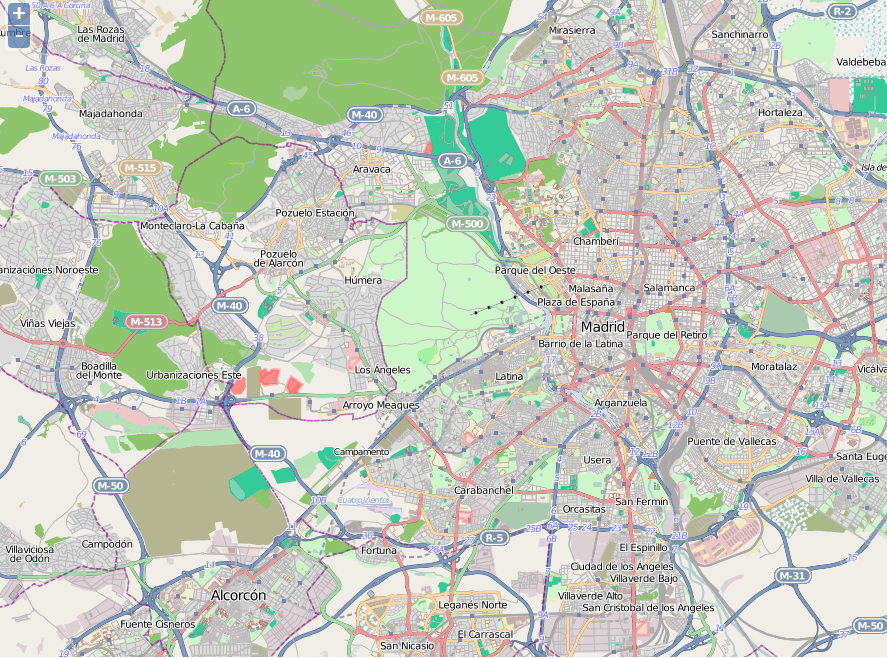 |
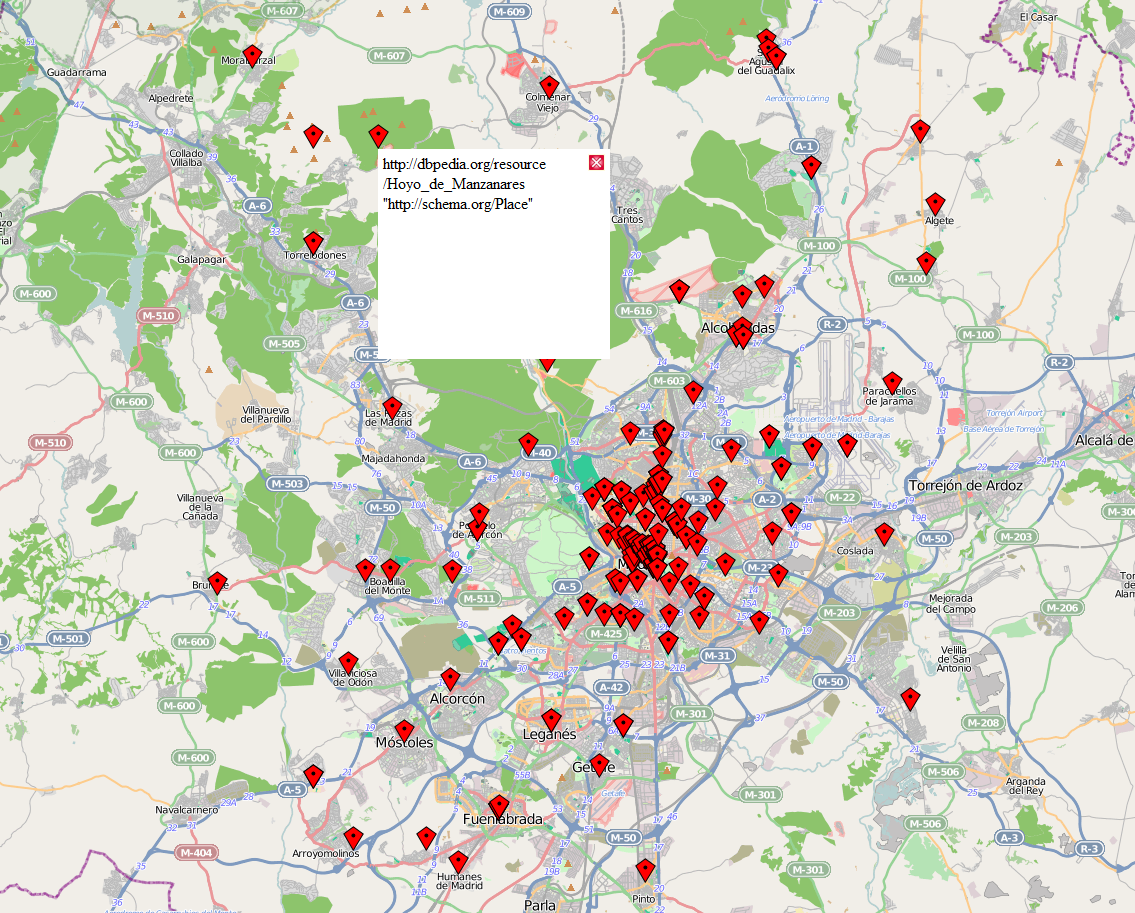
And this is the improved version . INTERACTIVE!!: it allows zooming, each geolocation is a "classic" marker that you can click, and a mini-popup shows the URL of the resource and the schema.org type.
 |
